How to Make Interactive Maps without Coding | Clockwork Micro's Mapmaker & Airtable
In today's world, efficient data management is essential for both personal and collaborative projects. Clockwork Micro’s Mapmaker offers a seamless solution for visualizing data on maps without the need for coding.
In this comprehensive guide, we'll walk you through the process of organizing your data in Airtable and integrating it with Mapmaker to create dynamic maps. Let's dive in and unlock efficiency and clarity in your data management journey!
Step 1: Organize Your Data in Airtable
To get started with organising your data in Airtable, follow these steps:
a. Create a new base in Airtable or select an existing one.
b. To keep things organised, give your base a name, such as "7 Wonders of the World."
c. Within your base, create a table with the same name for easy reference.
d. Add your data (like Name, Latitude, and Longitude.)
e. To enhance your records, consider hosting images on platforms like Imgur and adding links in JPEG format directly to Airtable.
Ensure your data is correctly structured and typo-free. Double-check entries for accuracy and proper formatting.
Step 2: Obtain Personal Access Token
a. Navigate to the 'Developer's Hub' and create a new token by clicking on "+Create New Token."
b. Give the token a descriptive name, such as "7 Wonders of the World"
c. Ensure that you select the scope data.records:read. This allows the mapmaker to access your data.
d. Under access, choose the base you're working on, then click on "Create Token."
Remember, this token is shared only once, so be sure to copy and save it in a secure location.
Step 3: Connecting Airtable with Mapmaker
To seamlessly integrate your Airtable data with Mapmaker, follow these steps:
a. Log in to your Clockwork Micro account.
b. Navigate to "Create A New Map" under "Map Tools" and click on "Go to Services."
c. On the right side of the map, click on "Data Sources." At the bottom, select "Create New Data Source."
d. Choose the Airtable option from the three data upload choices.
e. Adjust your map's zoom bounds. For this tutorial, set the minimum zoom level to 1 and the maximum to 15.
f. Name your Data Source for easy identification; for example, I'll name mine "7 Wonders of the World."
g. Find Base ID and Table ID by checking this link or referring to the image in the video.
h. Add the Personal Access Token you generated from the Airtable.
i. Verify that latitude and longitude field names match between Airtable and Mapmaker.
j. Finalize the map creation process by clicking on "Publish" and monitor the upload progress.
Depending on data size, it may take several minutes. In my case, with a small dataset, it took only one minute. You can refresh your browser to confirm if the data has been successfully uploaded.
Step 4: Uploading Airtable data on a New Map
a. Begin by clicking on the "New Map" option located in the upper right corner of your screen.
b. Once the new map loads, go to the "Data Sources" section, and you'll spot your data source titled "7 Wonders of the World."
c. Integrate your data source as a map layer by clicking on the blue icon beside it.
d. Then head to the "Active Layers" section to view your active layer.
e. Let's give this map a name. I'll give the same name, 7 wonders of the world, to this map.
f. To display the locations or points on the map, click on the green edit icon, and choose "point" under the "Type" option.
You can also adjust the color, size, and opacity of the circles directly from this interface.
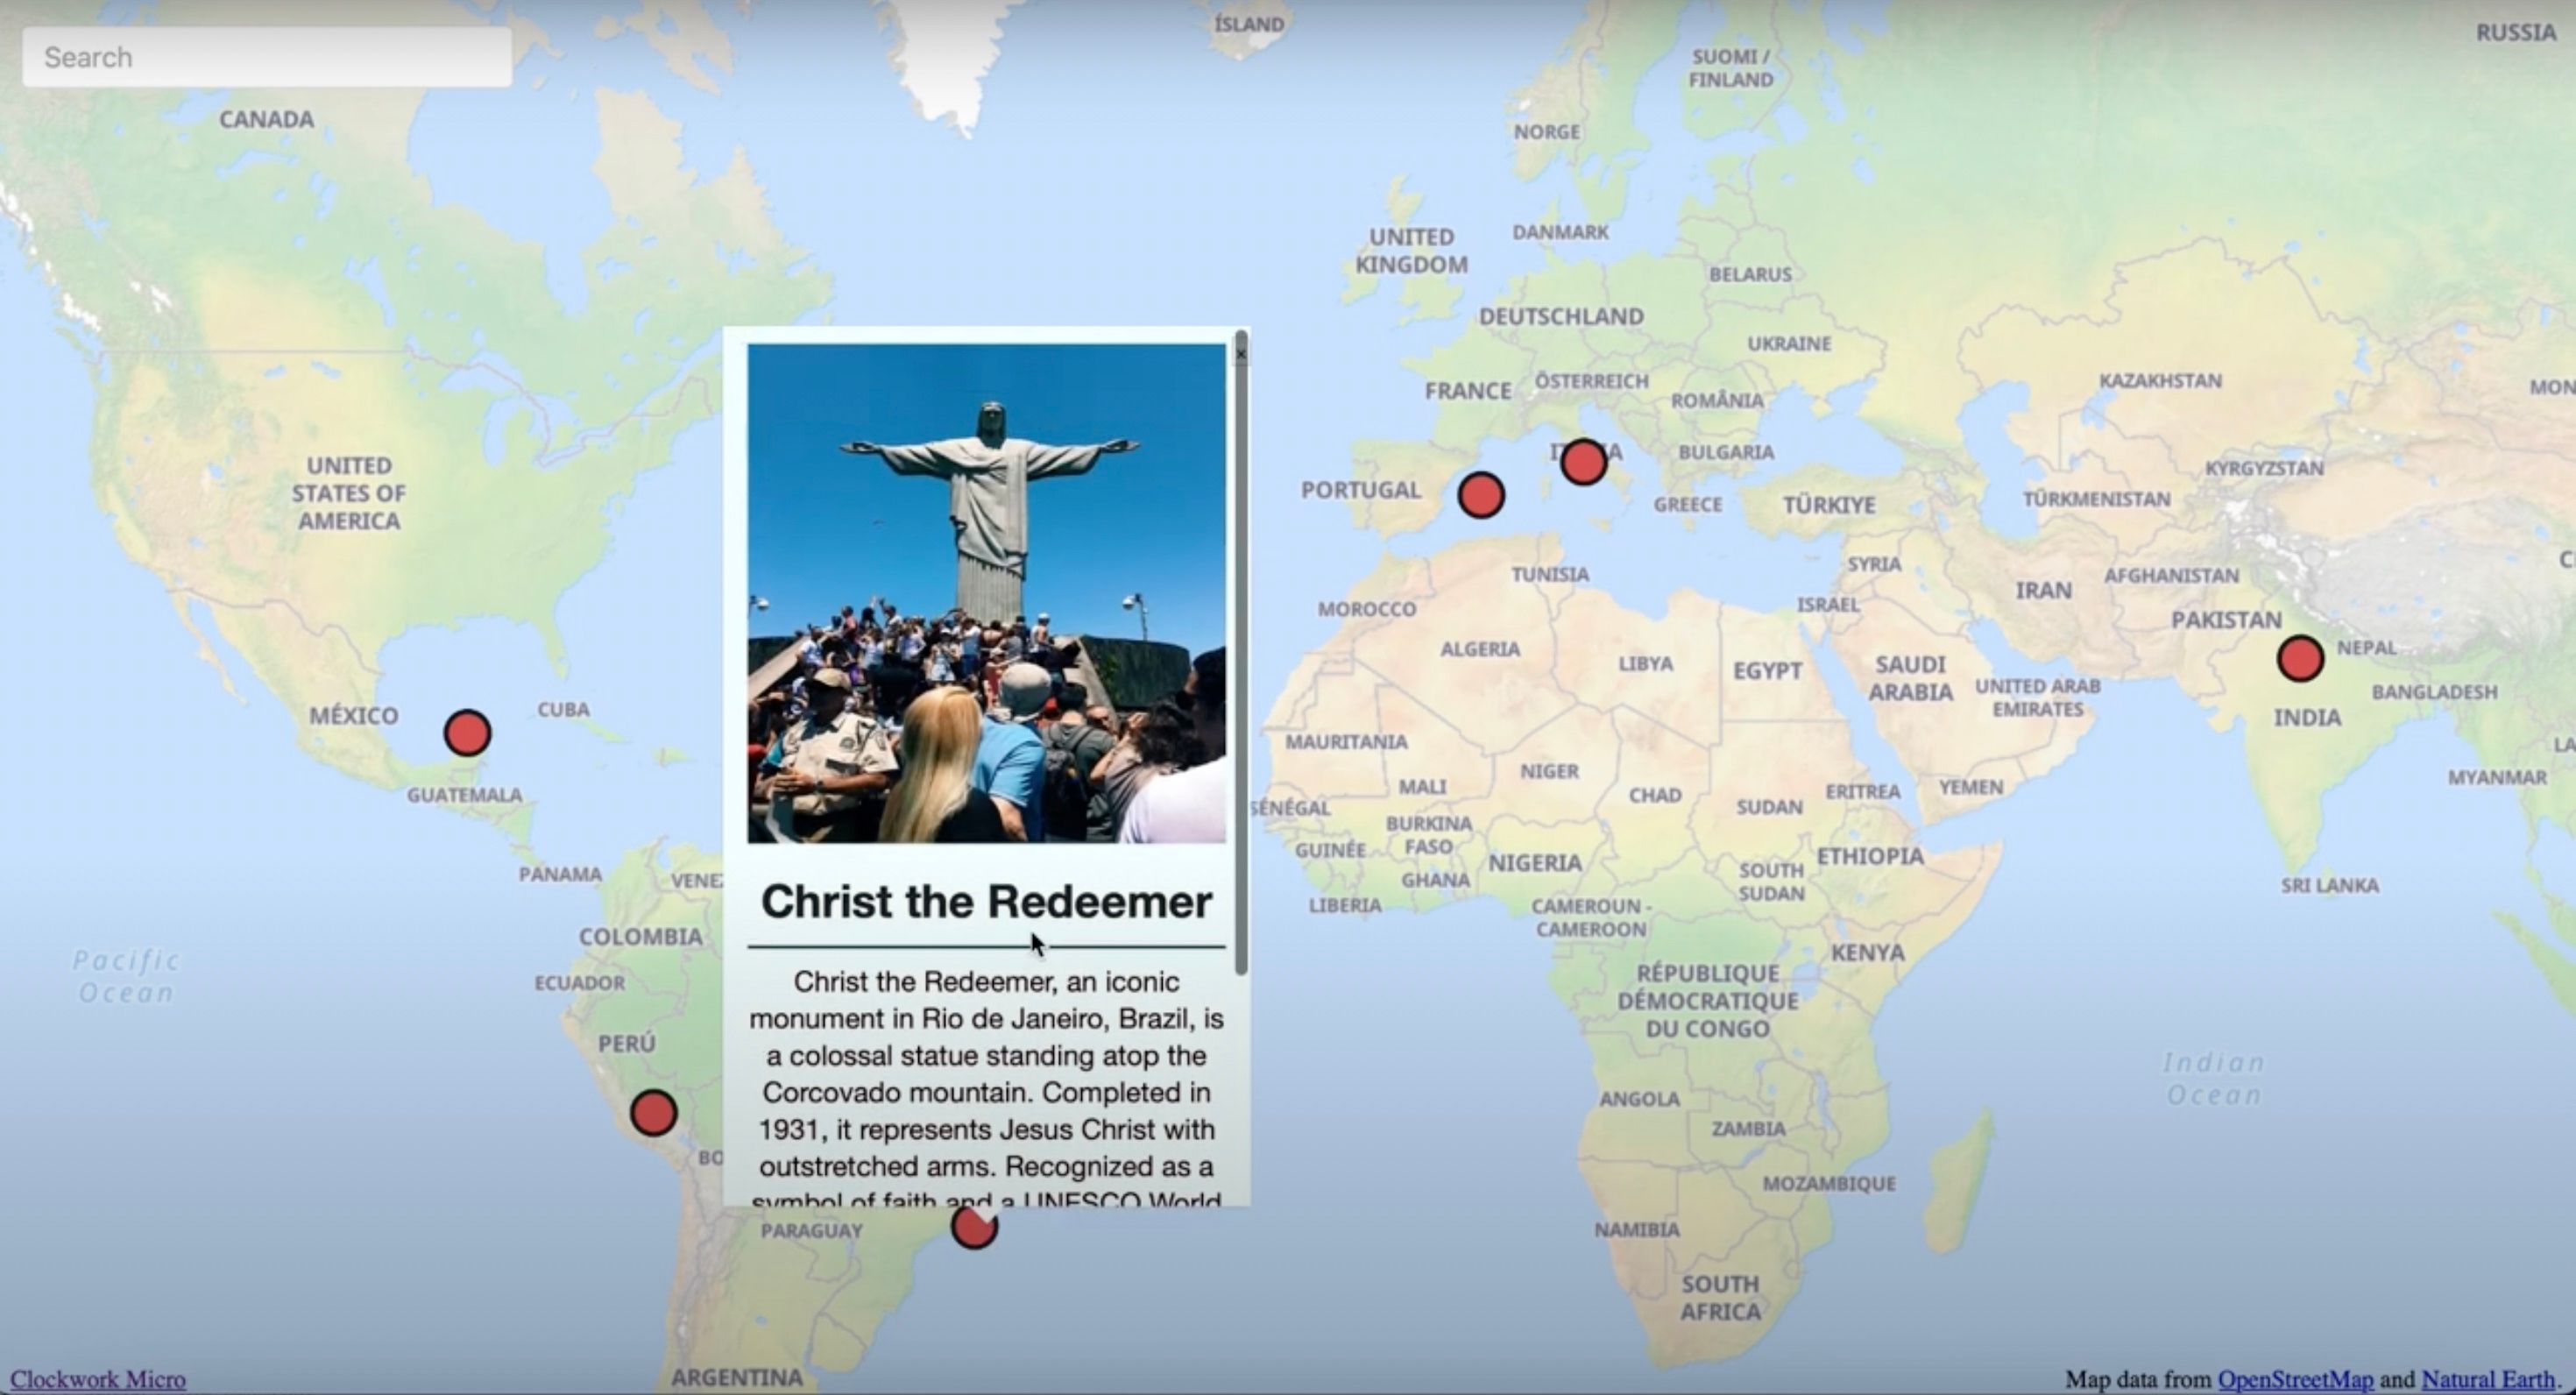
Step 5: Adding Pop-Ups
Let's add image and description for each location.
a. Click on the blue "Custom Popup Icon" within the Active Layers section.
b. Take charge of when the pop-up appears. I prefer the click option, so I'll select that.
c. Click on the small gear icon next to the image; an option to edit will appear on the right side.
d. Input the field names of the Airtable's column; Mapmaker will fetch information about each location from Airtable. For instance, I named the column storing image links as "Image."
Remember to enclose the field name within two curly brackets. If it appears in red, you got it right – it's formatted correctly. Scroll down to adjust the box height showing the image.
e. Ensure unique names for each location by clicking the small gear next to the header and repeating the process. Place the location's field name in Airtable inside curly brackets, e.g., "name."
f. Add details for each location. Since I named the field with information about each location on Airtable as "description," I'll write that word inside the curly brackets.
g. For this map, skip the "Click here for more information" section, as no links are added for each location.
h. Now that our pop-up is set, click on the green "Create" button.
Step 6: Sharing the Map
a. Now that I've got everything set up on the map, I'll just hit the save button.
b. That'll take me to a new page where I can check out all my other maps and see the new one I just made called "7 Wonders of the World."
c. Simply click on the blue Copy button to grab the map link. After that, paste it into your web browser. If you'd like, you can also add this link to an existing webpage.
And there you have it, the journey from a blank canvas to your very own interactive map of the 7 New Wonders of the World – all achieved without a single line of code. Congratulations on this map-making adventure! Whether it's for educational purposes, a travel blog, or just for fun, you've got a dynamic map at your fingertips!
To watch the whole video from start to finish on how to make this app, you can go to Clockwork Micro's Youtube channel.