Blog
Blog posts about our services and related topics.
One Airtable base map, unique display for each view (One administrator, multiple separate restricted views)
Create one map for an Airtable base table and then restrict the display to data in separate views for each user.

Simple API endpoint allows use to export AirTable tables as geojson for use in maps. No-code, of course.
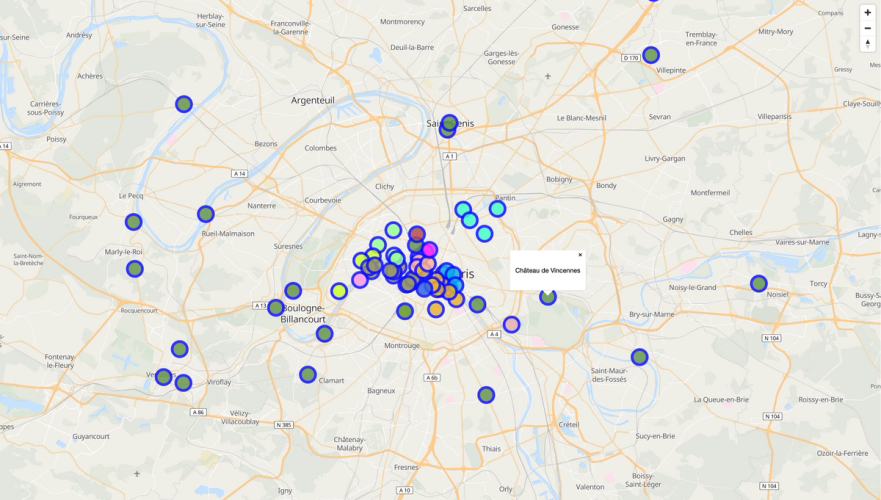
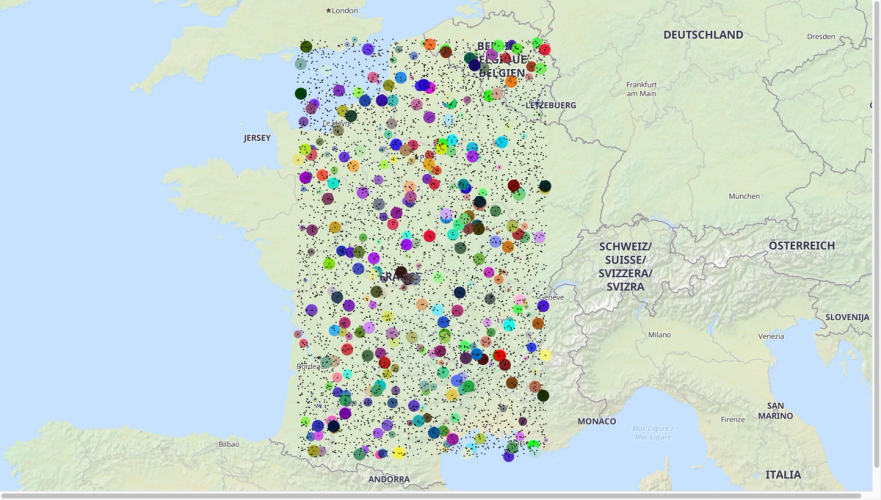
This project uses a deck.gl layer with MapLibre and a Clockwork Micro base map in order to display the sights in Île-de-France. We will also colour the points according to the districts of these sights.

Clockwork Micro has completed several custom projects related to the USDA SSURGO dataset. All of these involved large scale data manipulation and complicated custom queries.
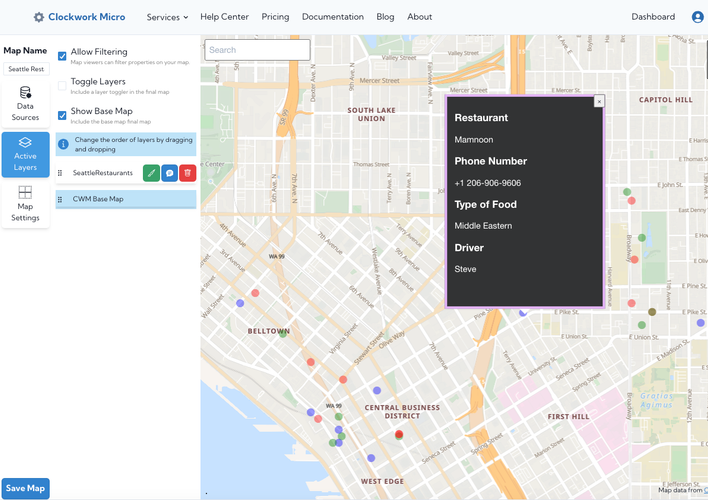
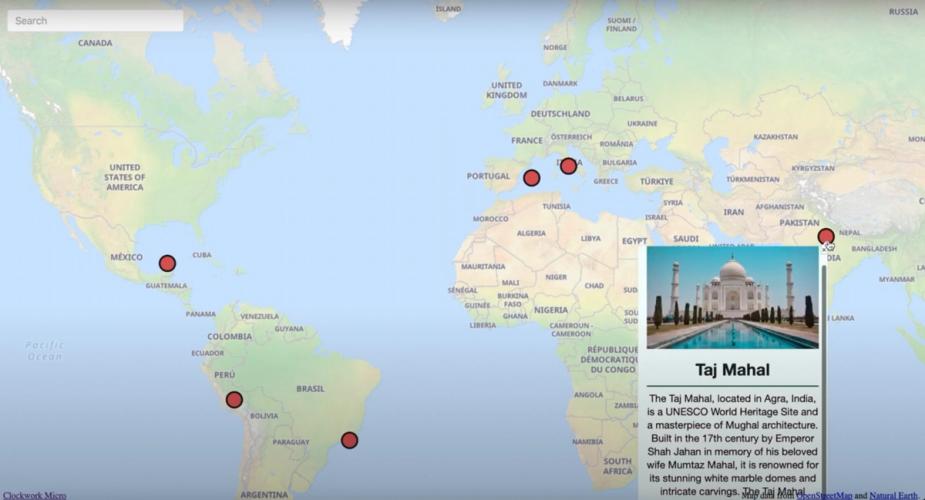
We show how to toggle a deck.gl layer using a Clockwork Micro basemap and MapLibre. We will use a MapLibre popup for displaying information about the selected point.
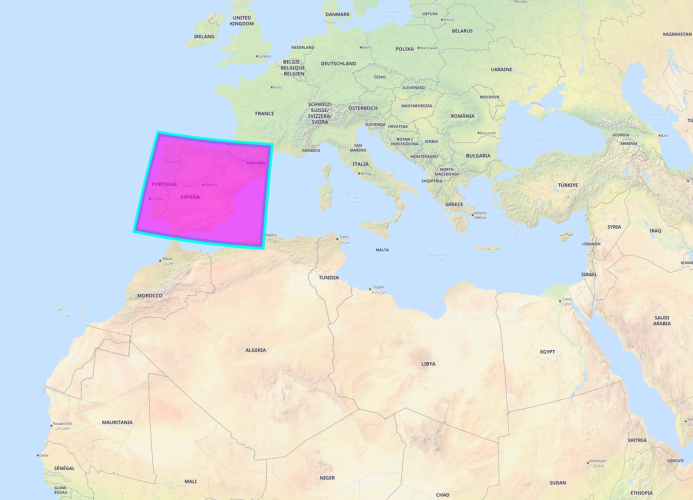
We’ve just released a powerful new feature that makes working with our maps more flexible and developer-friendly than ever: you can now add your own GeoJSON layers directly through URL parameters.
You can instantly visualize your own LineString, Polygon, and Point data on top of our map with no additional setup, plugin, or code changes required. Just pass your GeoJSON in the URL and the map renders it on the fly.

Discover how to turn raw data into actionable, interactive maps with Clockwork Micro. Learn how visualizing data can boost efficiency, engagement, and strategic decision-making.


Unlock the secrets of effective experience mapping! This guide walks you through creating a customer journey map, enhancing user experience with practical examples.
In today's world, efficient data management is essential for both personal and collaborative projects. Clockwork Micro’s Mapmaker offers a seamless solution for visualizing data on maps without the need for coding.

Discover how real-time tracking can optimize your business operations. Save time and money with efficient asset tracking and enhanced decision-making.

Discover the advantages of a low-code and no-code map maker, enabling rapid automation and efficient solutions without extensive coding.
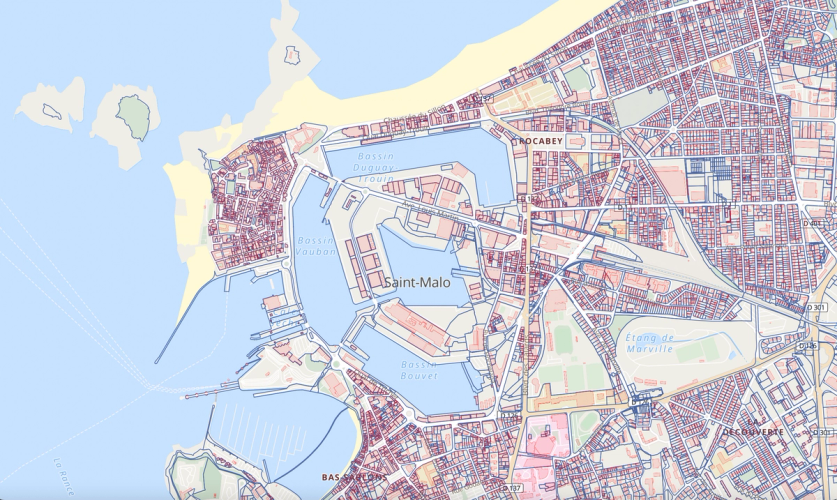
We converted a 33 GB MBTiles file covering all of France to a single PMTiles file using Docker and loaded to S3. We provide several simple tips.
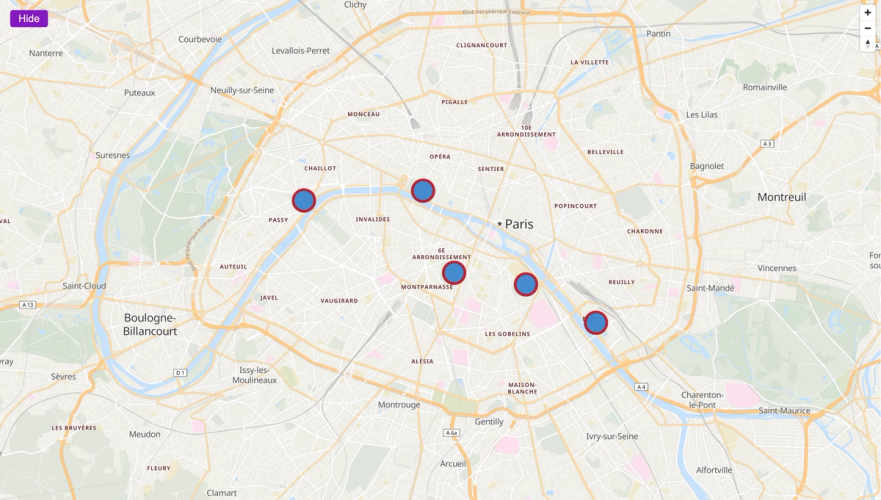
This is a basic example for displaying what can be achieved using the deck.gl transitions. We will simply make use of the DataFilterExtension deck.gl offers in order to periodically highlight multiple points on our map.

Add an interactive map to your website in minutes with Clockwork Micro’s low-code Map Maker. Enhance user engagement, showcase locations, and integrate custom data seamlessly, all while maintaining a user-friendly experience. Perfect for businesses looking to elevate their online presence with dynamic, customizable maps.

We show how easy it is to customize a data pop-up using New York City neighborhood names as an example.

Discover how real-time tracking can optimize your business operations. Save time and money with efficient asset tracking and enhanced decision-making.

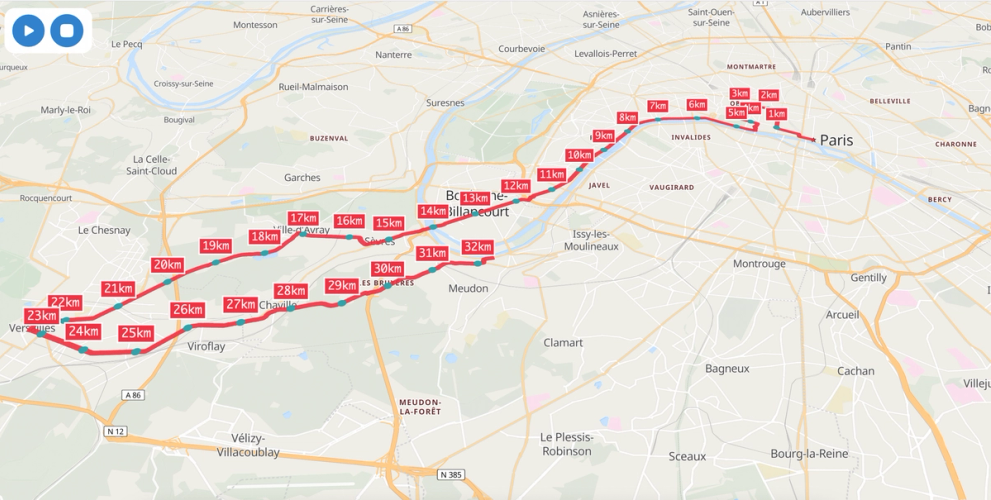
La coulée verte René-Dumont est une voie piétonne en plein cœur de Paris.
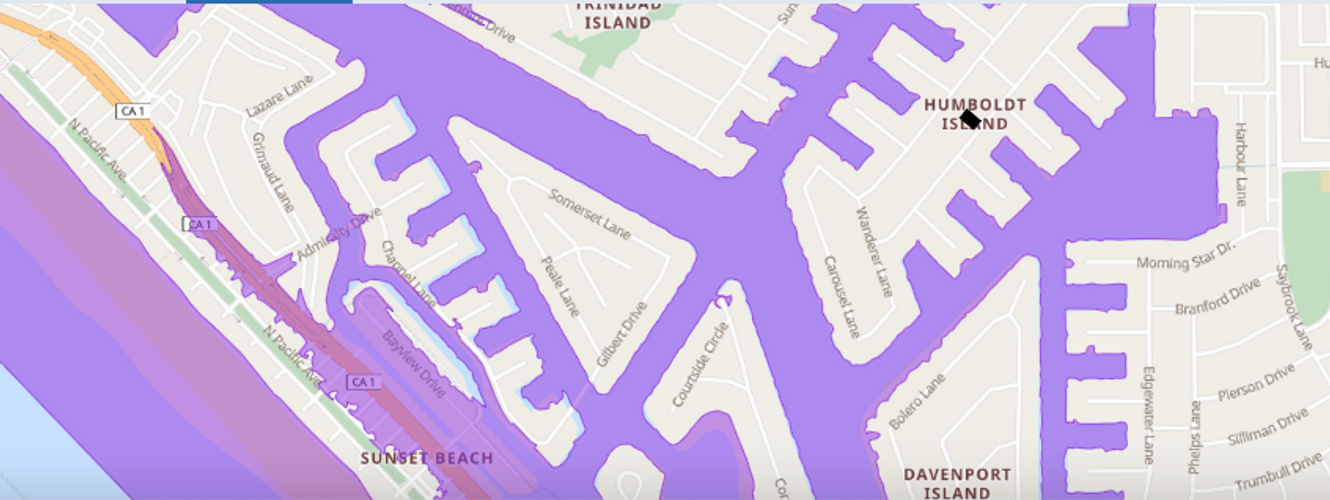
National Flood Data uses DB2Vector to offer a continuously updated web map for national flood maps that are updated daily. This implementation demonstrates a primary use for DB2Vector: large geospatial datasets that require regular updates.

An example of a simple web map using MapLibre to display vector tiles as polygons, lines and points.
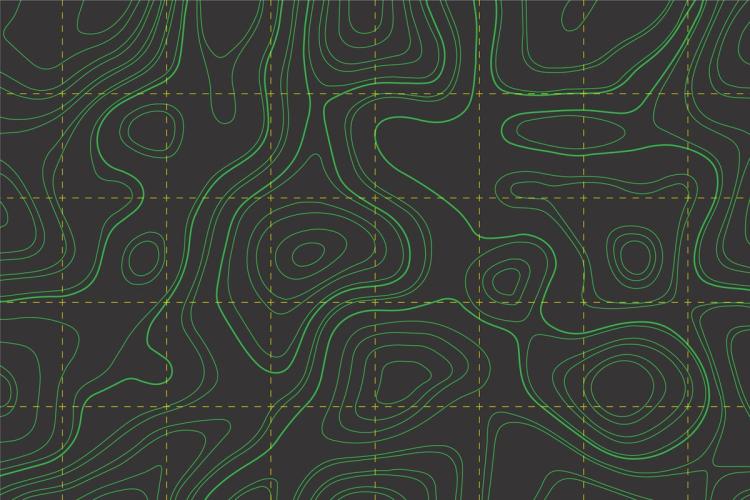
USGS 7.5-Minute Topo Maps: Your precise guide for outdoor exploration, showcasing elevation changes, landmarks, and terrain insights across 49 sq. miles. No tech needed!