Making a NYC Neighborhoods Map with No Coding
We show how easy it is to customize a data pop-up using New York City neighborhood names as an example.
Our goal is to make a map of New York City that allows a user to move the mouse over neighborhood outlines and see the neighborhood names displayed in a popup window. We can do that very easily and with no code.
We will use the shapefile "2020 Census Tracts (Clipped to Shoreline)" hosted at the NYC Planning website. This dataset has the borough and neighborhood boundaries and names we want to display.
In the Clockwork Micro Dashboard we select Create a Map.
To get started we change the name of the map to NYC and click Save Map. This creates the map are routes us to our set of maps, and here we click the map we just created.
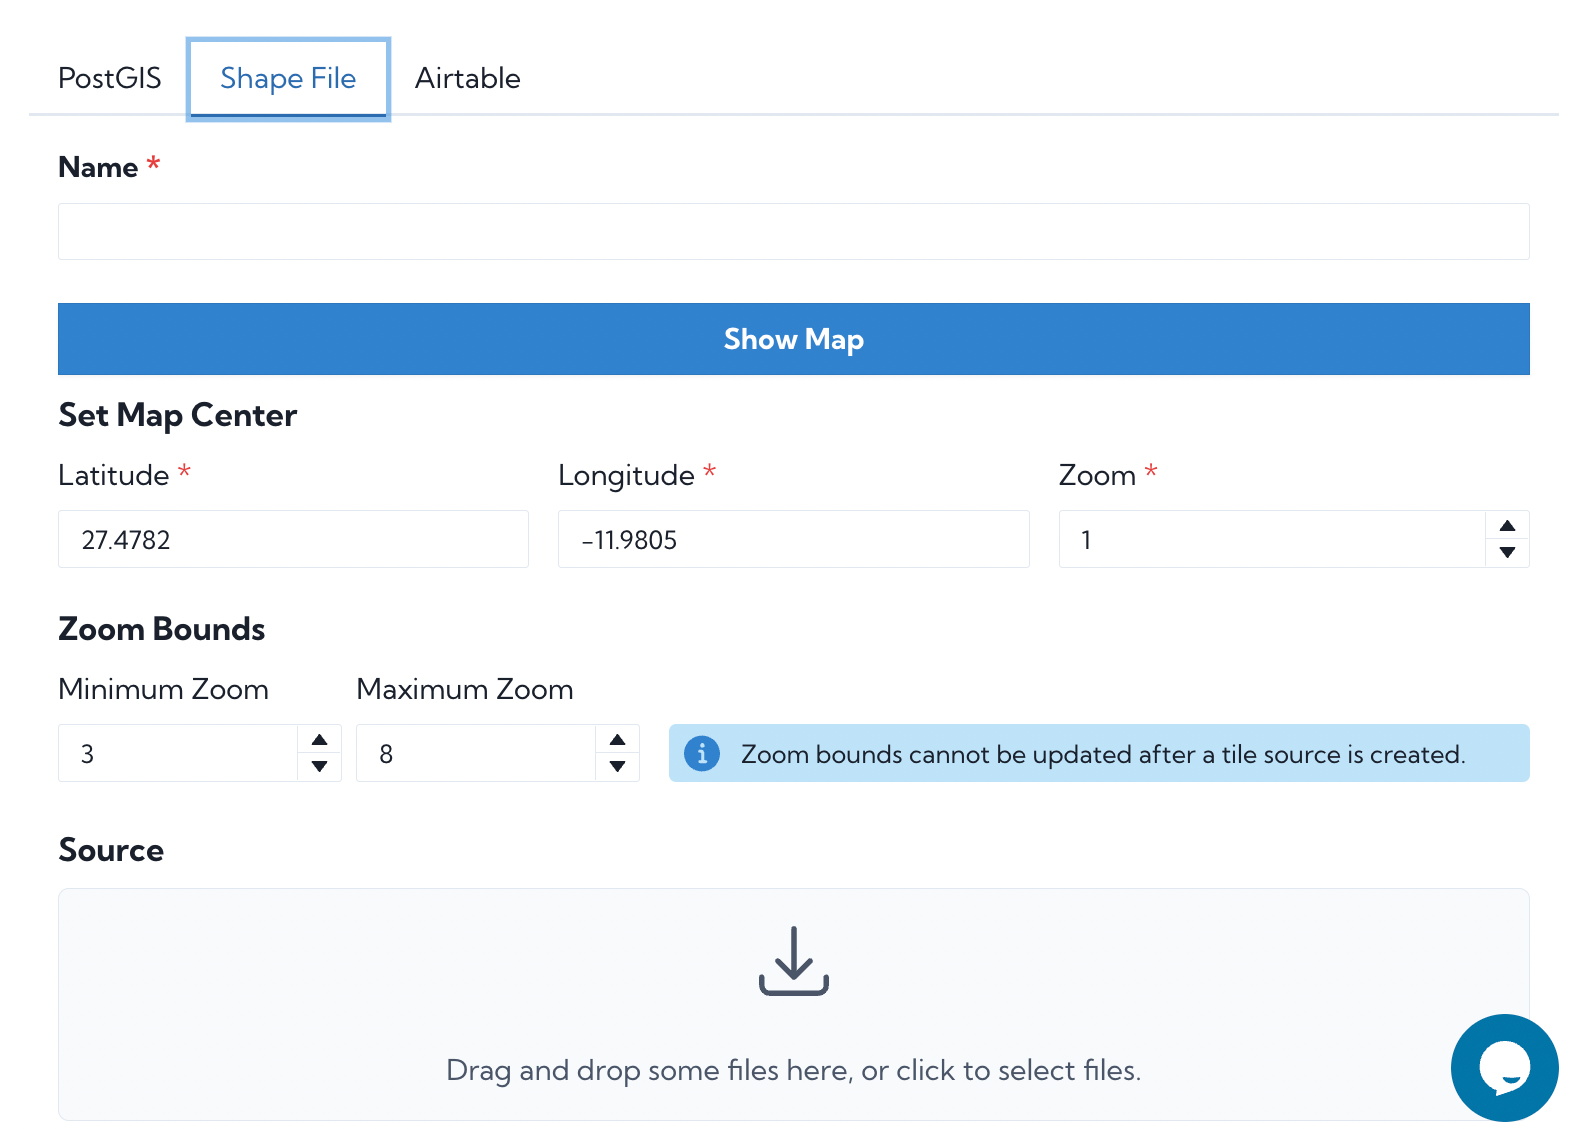
We click Data Sources and then Add a Data Source. Our data source is a shapefile, and so we select that type, then drag-and-drop the shapefile (actually a set of files), choose the zoom range 2-15 and submit.
In several minutes the datasource will be ready. In the Dashboard we click "Your Existing Maps" and then our NYC map.
Under Data Sources we select the button Add to Map to the right of our data source.
Now the fun part. We zoom in more closely to New York City until we see the polygons.
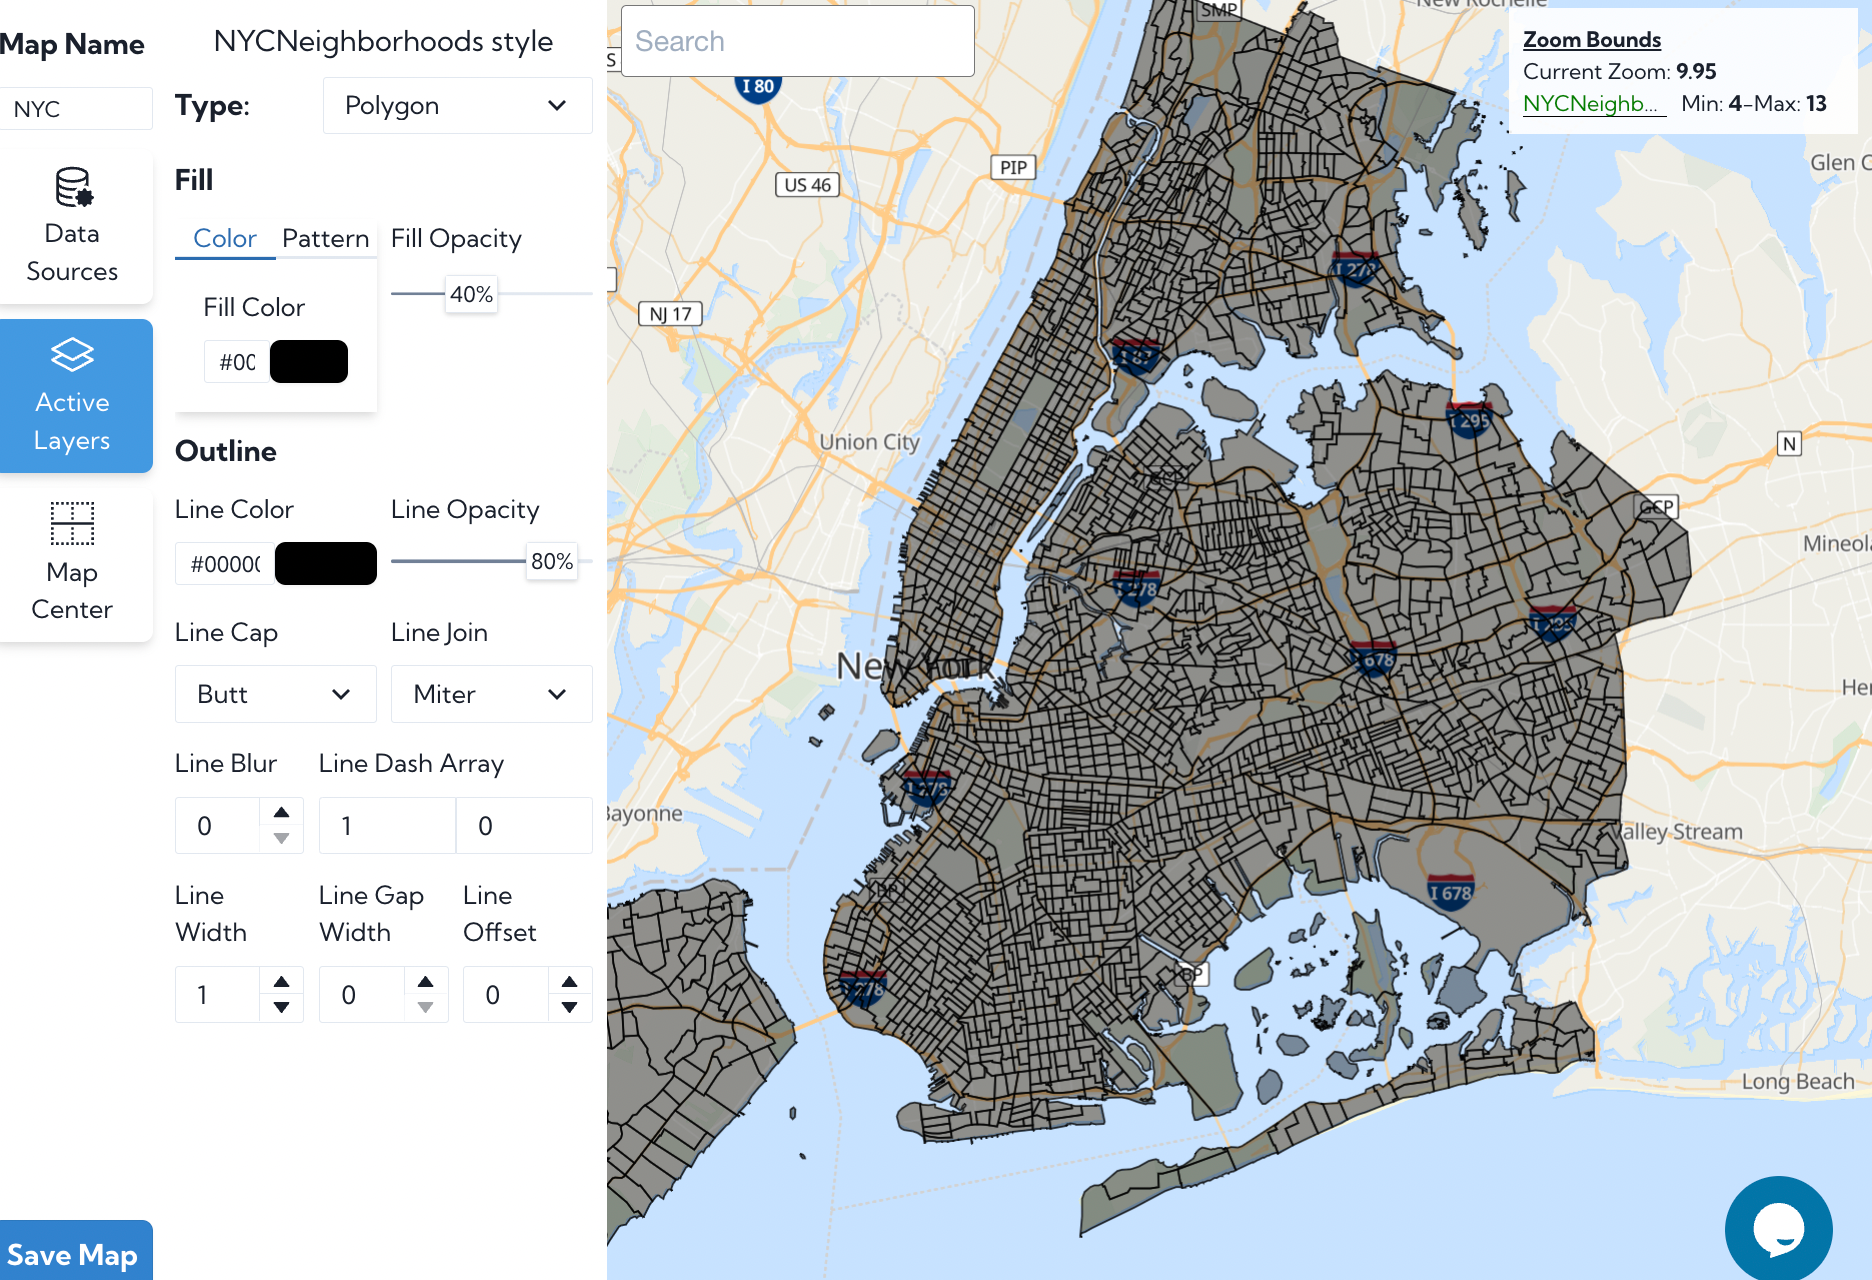
We adjust the color and shade as we like and then click the blue Custom Popup icon. The easiest way to start is to choose a template and then edit the template. Here we've chosen light-template-1.
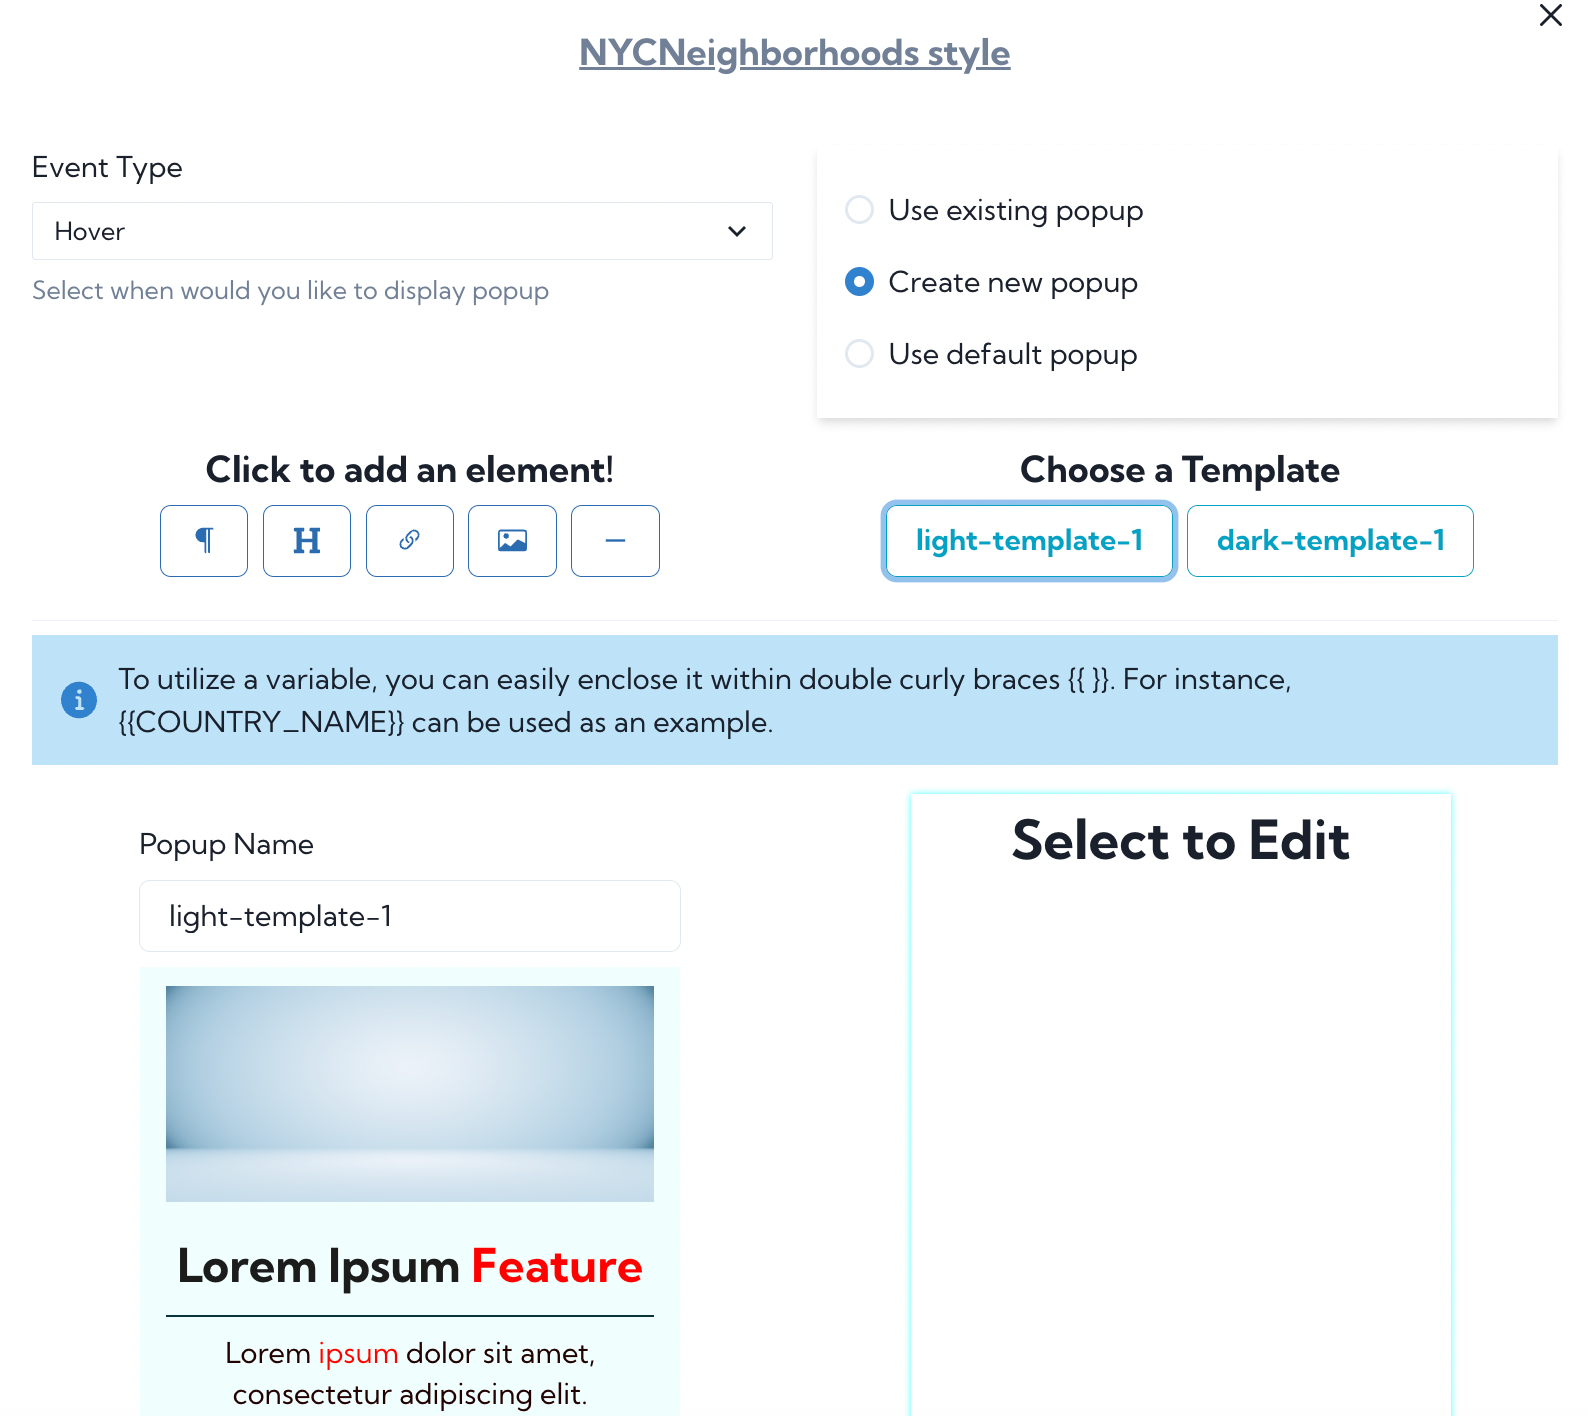
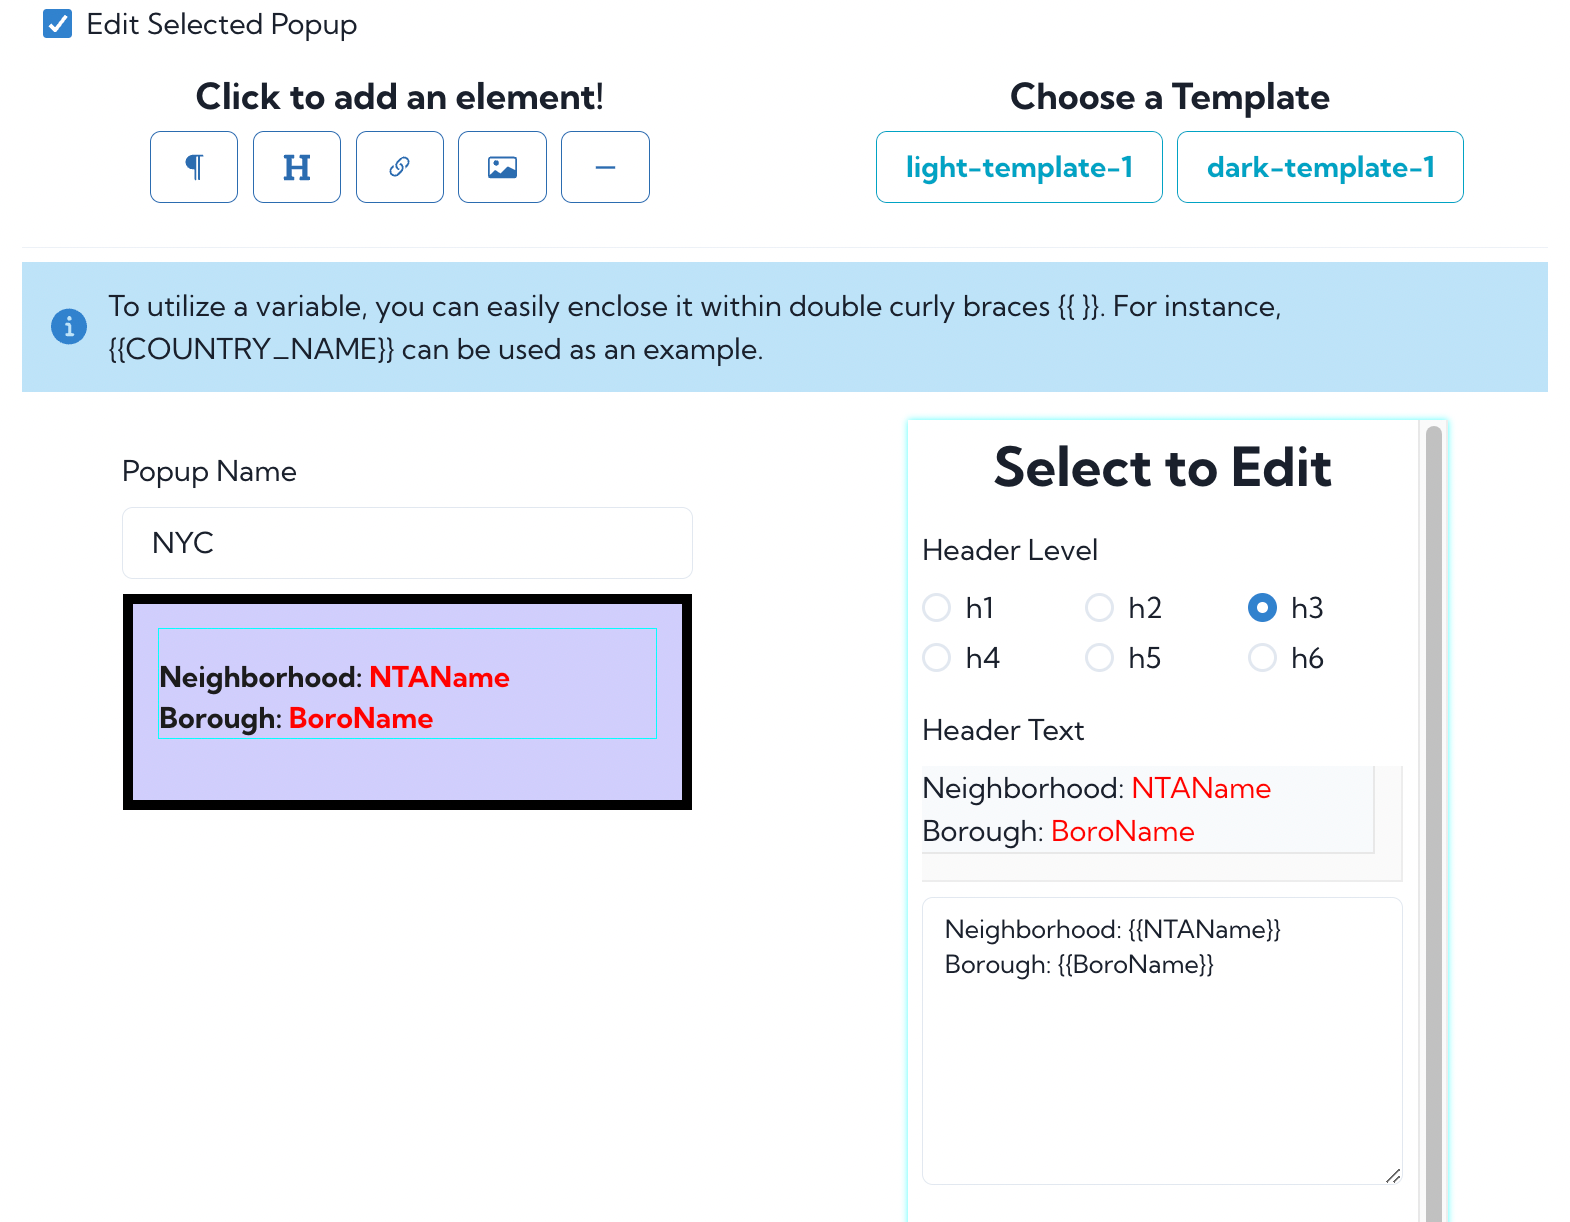
We'd like the popup to show the neighborhood name and the borough name. The names for these fields in the dataset are "NTAName" and "BoroName", so we select the text area and click the gear where to edit it. Then we edit the text to read:
Neighborhood: {{NTAName}}
Borough: {{BoroName}}
With this formatting, the value NTAName will be inserted and the same for BoroName. We remove the extra text in the template, adjust the size and color, and then choose the event type Hover. Don't forget to save the map again with these edits.
The polygons are census blocks and so sometimes multiple census blocks have the same neighborhood name.
Our map is ready. In the Dashboard we choose to see our maps, and then copy the endpoint for our map of New York City neighborhoods. We can embed that map in our webpage.
A final tip: save your map as you make it. If you navigate away from the Map Maker page without saving your work, you will lose your edits.